Blog Posts

Sometimes I write about the things I do in R

Data exploration

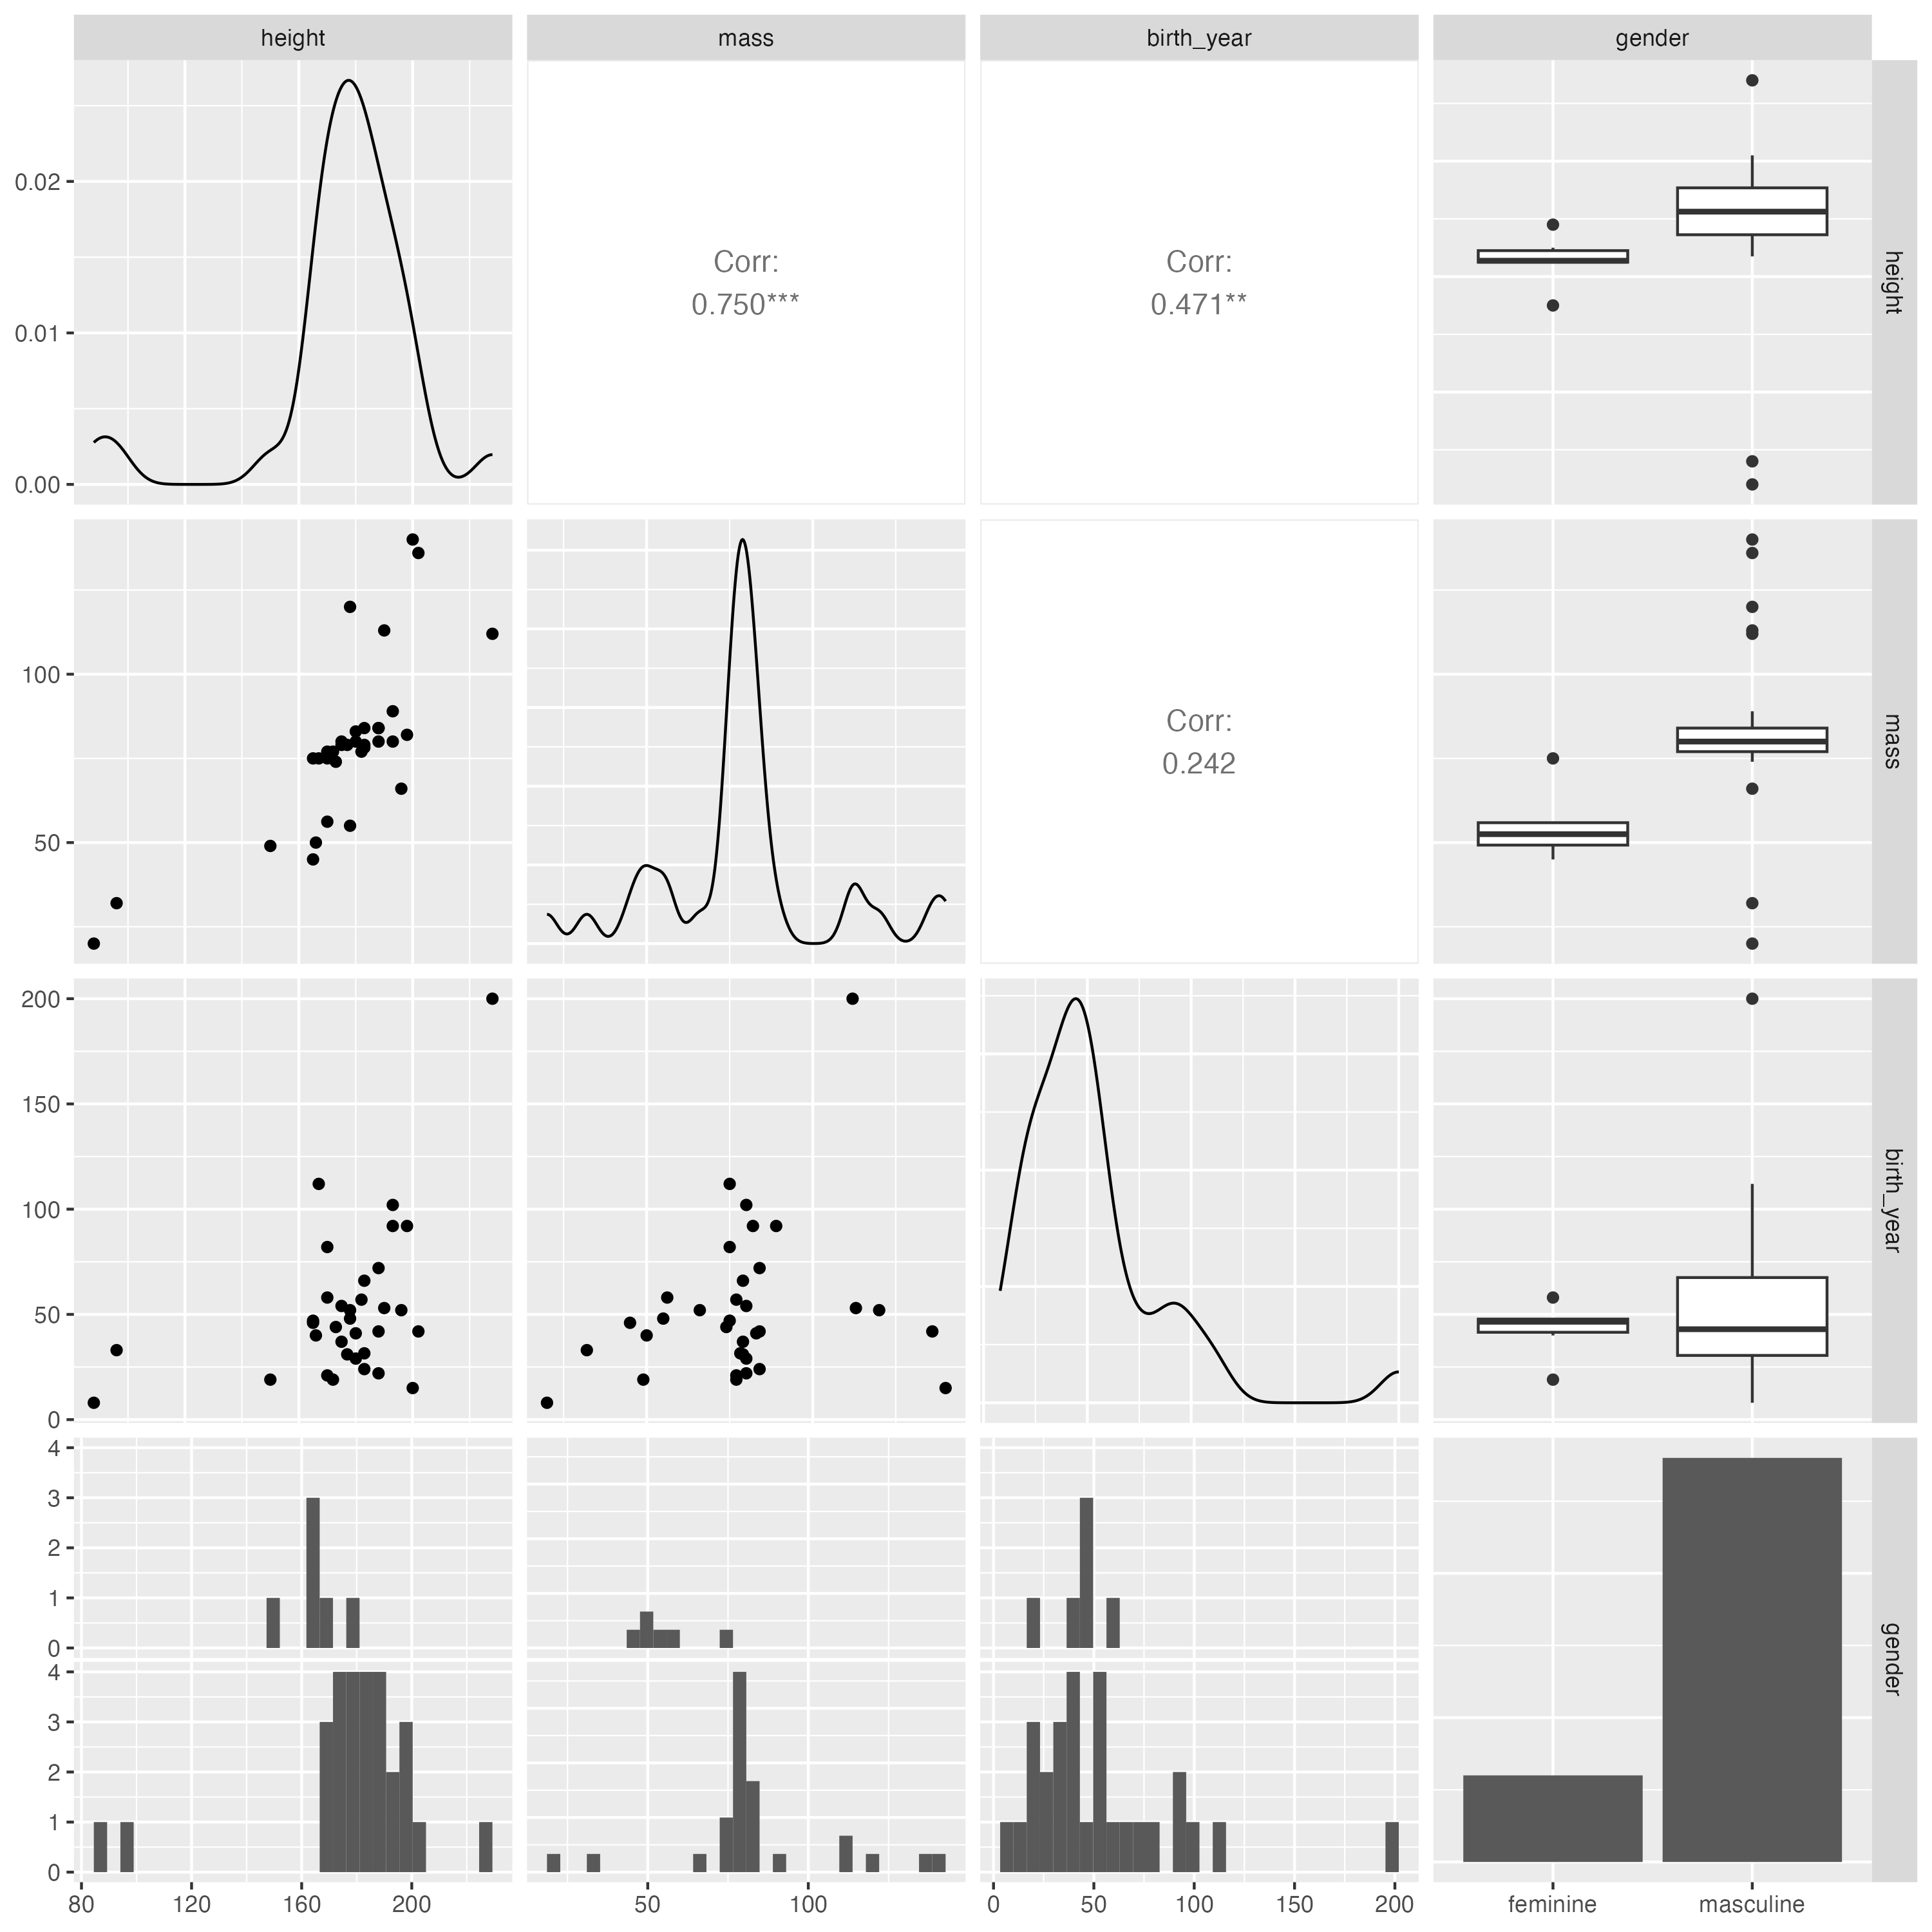
My data exploration workflow

Create print-ready tables showing frequencies and descriptive statistics and produce plot matrices useful for exploring the distribution of, and basic relationships between, different variables in a dataset.
Data exploration & visualisation

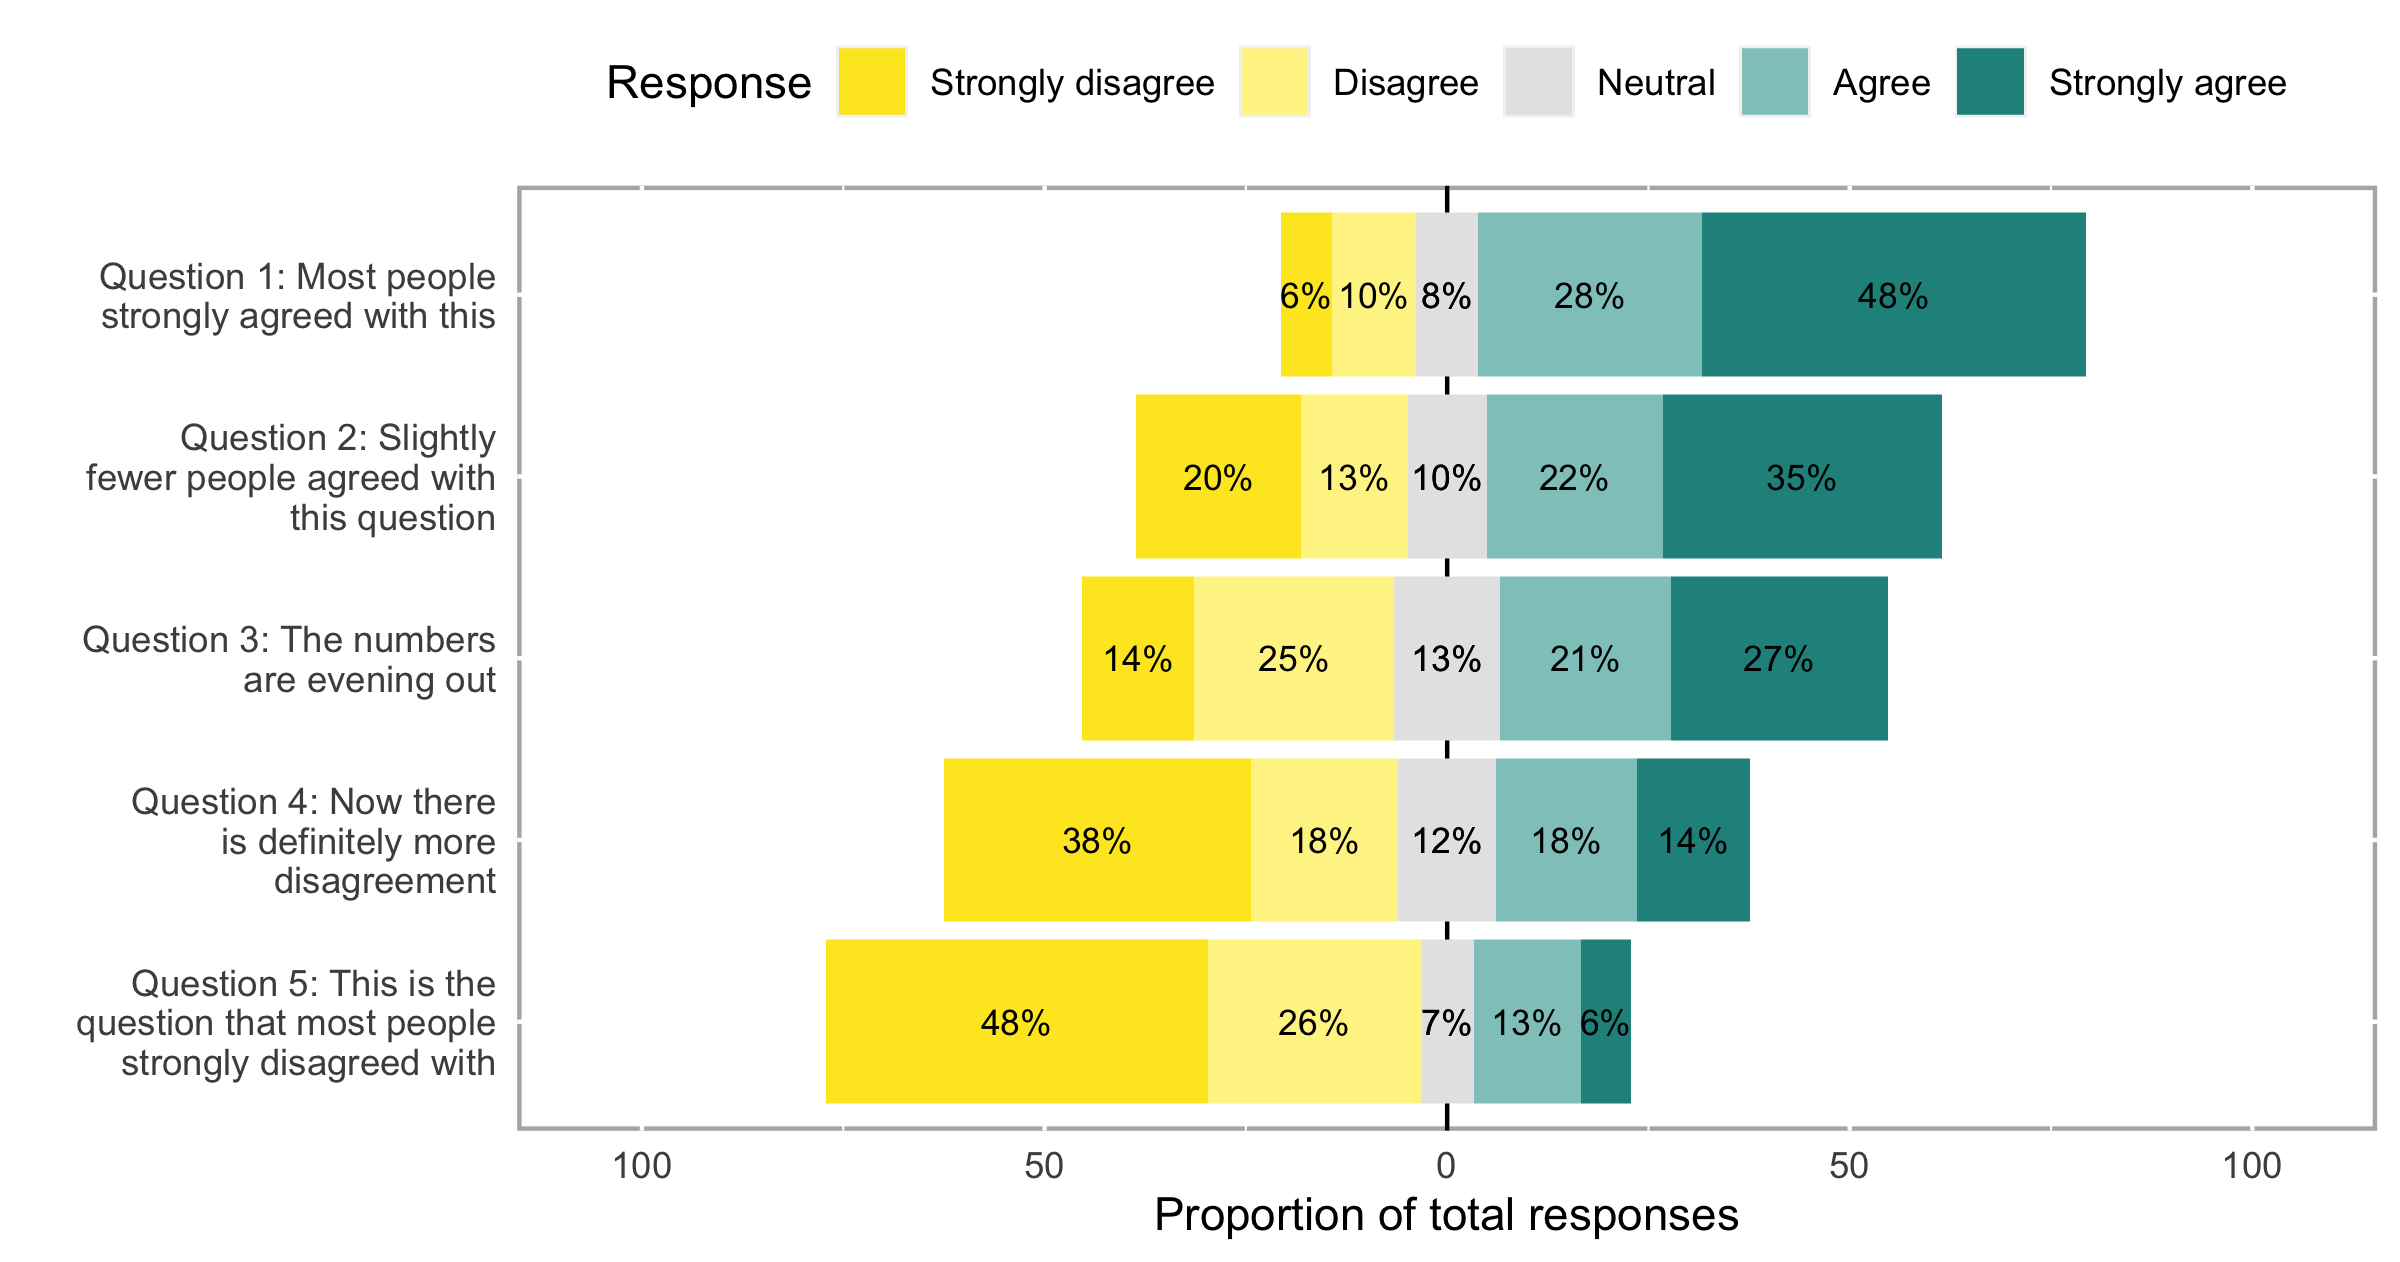
Summarise and visualise Likert scale data

Summarise and visualise Likert scale data with the aptly named likert package and costomise plots with ggplot2 syntax

Data visualisation

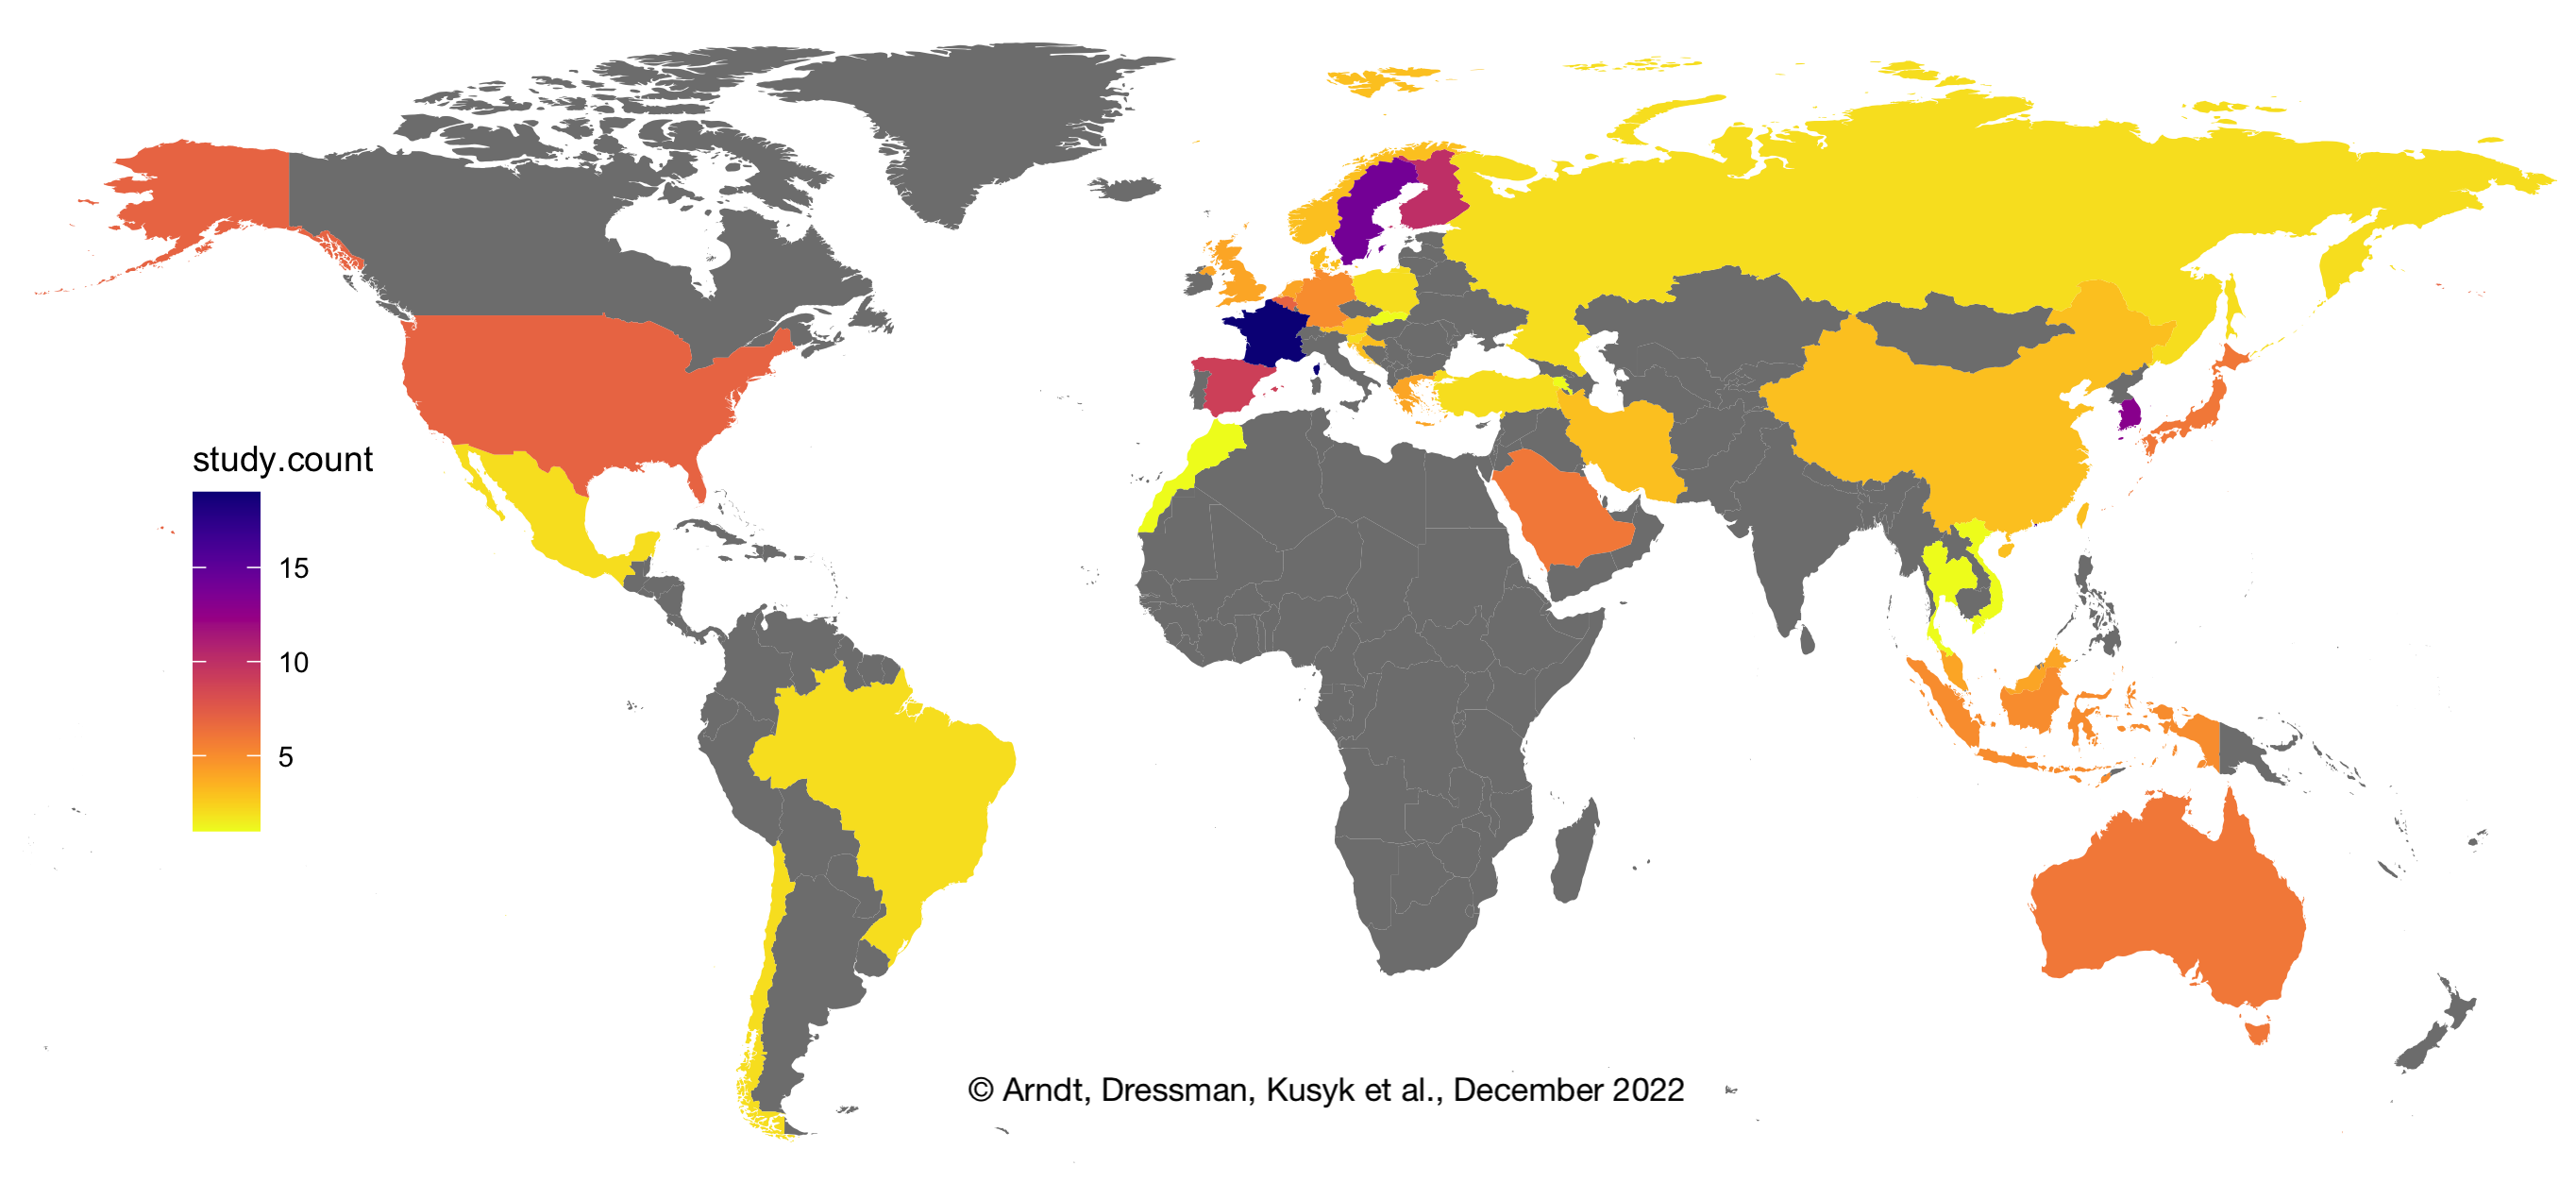
World map visualisation

Create a map plot within the tidyverse, which you can easily adapt to visualize different types of data by country, including continuous (e.g., population counts) and categorical variables (e.g., dominant language).